
Data touches every aspect of our lives. Every time we go to the store, visit a website, make an appointment with the doctor, travel by airplane, or take a photo; we are creating, using, and leaving behind data. The modern world is measured, mapped, and recorded in ways that were difficult to imagine even just a decade ago.
The presence of all of this data is having a profound impact on the way we live our lives. Everything from smart phones, internet-enabled devices, self-driving vehicles, satellite imagery, and countless smaller services that get use everyday utilize data. Data allows us to make discoveries about ourselves and to make connections with an increasingly connected world.
Machine learning is one of the most powerful tools we have today to help us make sense of data. It can help us uncover what data is important and provide some insight into why. In this article, we will introduce the concept of machine learning, some ways it can be used to gain insight from data, as well as a few of the algorithms that make it is possible.
What is Artificial Intelligence, and what is Machine Learning?
Few trends have been hyped as heavily as artificial intelligence. In the popular imagination, AI conjures pictures of super computers that talk to us, killer robots, and machine companions. But beyond fantasy, these portrayals do not tell us what AI means today or how it might impact our lives. To that end, what is AI and how does it relate to machine learning? Why are they significant, and why do they garner such attention?
An AI system simply refers to a type of program that has the capacity to learn without being explicitly programmed. Programs that incorporate AI are exposed to different types of input, are capable of “acquiring experience”, and are able to make choices when faced with similar choices in the future.
The types of problems that artificial intelligence can be applied are very broad. They include: predicting the price of stocks, estimating the marketability and performance of products, recognizing faces in a photo, and such as transcribing speech from a recording.
The enormous diversity of applications that can be performed with AI can make it seem intimidating. At the same time, it is this seemingly infinite spectrum of possible uses that also makes it so powerful. AI may be infused with almost any type of technology, and in doing so, allows for it to learn from its experiences. As AI becomes more capable, it will allow for the world around us to come alive and enable the types of futures we see in movies and books.
How Does AI Work?
Under the hood, AI takes advantage of a computer’s ability to ingest enormous amounts of data, utilize clever mathematics and logic to detect patterns, and incorporate those patterns back into the original data. This makes it extremely similar to the method that the human brain uses to process information.
What distinguishes AI from human learning, however, is the remarkable speed in which computers handle data. While humans are better at drawing inferences from small amounts of data, an AI system can leverage entire libraries relatively quickly. A human doctor, for example, might review over 10,000 cases of disease throughout her career; a computer, on the other hand, can be capable of reviewing the same amount of information in an hour (or even a minute, depending on the resources available).
It’s the scale of modern data and massive increases in computational power that provides AI with such power. With the decreasing cost of sensors, proliferation of Internet-connected devices of all kinds (including refrigerators and smart toilets), and ubiquitous ability to measure and record data; nearly every action we take can be recorded in a database somewhere. The amount of data collected is expanding so quickly, that 90% of available information is less than five years old. With new data comes new opportunities to mine, analyze, and use the data for a better understanding of the world in which we live.
Using Data to Solve Problems, Investigate Relationships, and Detect Fraud
Data is a powerful resource that humans can use to solve their problems. We use data to recognize patterns in behavior, and with this abstraction, we can predict what events might follow.
For example, let’s say you are investigating a scandal that took place in an organization. Your job is to identify employees that were potentially involved in the scandal. A few executives might already be on trial for fraudulent actions, but there may still be hundreds (or thousands) of employees involved in the affair that needs to be investigated. Because the number of potential persons of interest is too great to have human investigators explore every lead, however, might AI help to identify persons of interest and prioritize follow-up?
In November 2001, Enron, a Houston based energy company filed for bankruptcy. The company’s CEO, Jeffery Skilling, along with a large staff of executives had spent years using accounting loopholes, special purpose entities, and poor financial reporting to defraud billions of dollars from the corporation. When the situation came to light, the resulting scandal destroyed the company along with its auditing Arthur Andersen and investigators found themselves in precisely the situation described above.
Can data help to provide insight on the question of “who to investigate” and might AI help to narrow down the list? The figure below shows a set of employee names, their annual salaries, and an “outcome” column indicating whether their activity appears fraudulent. Does this information give us any insight?
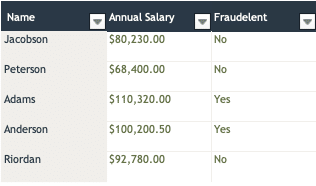
If we used this data to make predictions on which employees are engaged in corporate fraud, we might infer that if an employee’s last name starts with an A, or if the annual salary is greater than $100,000 a year, that these are red flags which merit additional investigation. But are those appropriate conclusions?
Unlikely. With only the information above, a more appropriate conclusion is: the data is inconclusive. But what happens as we expand the pool of available information? What if instead of five individuals we are able to explore data from hundreds or thousands?
As the amount of data expands, we are better able to understand whether trends in name or salary might be indicative of fraud. But we hit a second limitation, the human mind is usually only able to consider a handful of variables. When considering name and salary, we might be able to extract some trends or patterns. But are these the best indicators of fraud? There are potentially dozens (maybe even hundreds) of variables that might be predictive of nefarious action, have we selected the best?
While the human mind may not be able to consider hundreds of potential relationships, AI is not so encumbered. Computers are happiest when confronted with enormous datasets, perhaps including hundreds of thousands or millions of rows and thousands or tens of thousands of variables. We might expand the available variables to include:
- What’s the employee’s position in the company?
- What tasks do they do?
- What are their employee benefits?
- How often does the employee email higher-level executives of the organization?
AI systems are capable of analyzing the variables, fitting models to the outcome being explored, and not only predicting which individuals might be persons of interest; but also explaining which features of most predictive of criminal activity.
Where Does Machine Learning Fit In?
So where does machine learning fit into all of this? The various applications of AI can be divided into several different classifications, including general purpose AI and narrow AI.
- General Purpose A.I. attempts to teach machines to understand the world as humans do. The goal is to allow a machine to think, reason, plan, learn and communicate as a person might.
- Narrow A.I., in contrast, is designed to perform very specific tasks (such as diagnosing disease from medical images, predicting stock prices, filtering spam email messages, finding the most efficient route to arrive at a location) with the highest degree of accuracy possible, or determining if an employee might be a person of interest.
Machine Learning (or ML) falls into the latter type of AI. It uses statistical techniques to create predictive models which fit a set of data that is used to “train” them. Once a model has been trained, it is capable of providing new predictions by applying the model to new sets of data.
How is Machine Learning Used?
Machine learning is used across a wide variety of industries and applications.
Healthcare
Within healthcare, machine learning models are used to assess medical records and diagnostic data in order to recommend treatment and therapy. Related technologies, such as digital assistants, help save time by analyzing schedules and helping to reduce unnecessary visits. It has also been used successfully to streamline administrative workflow providing billions in annual savings.

Financial Services
Banks and other financial service companies use machine learning to understand important trends, prevent fraud, and generate forecasts. The insights produced can help identify opportunities, manage risk, or help investors know when to make trades.

Government
Public agencies use machine learning for a huge variety of needs such as analyzing satellite photos, creating models of weather, and looking for signs of fraud or identity theft.
Millions of data points are processed and read every day by machine learning models. For uses such as identity theft and credit card fraud, real-time reports are essential to recognize these threats to prevent further harm.

Oil and Gas
Machine learning helps companies like Exxon Mobil to find new sources of energy, actively monitor their infrastructure and predict failure, and streamline operations. Other operations utilize regression models to predict future pricing of units.

Applying Machine Learning to Problems
How do you go about gathering data and taking your first steps into a machine learning journey?
Building Machine Learning Models
Despite its wide-ranging sets of applications, the process of building and applying machine learning models can be grouped into a number of discrete steps that are similar across industries and use-cases:
- Acquire Data. Before data can be analyzed, it must be acquired. You need to know what kinds of information you have at your disposal, where it came from, and the limitations on where and how it was acquired (the methodology). While acquiring data, it is also good to know what other information is available. Traditionally, many organizations have kept their information in databases that are maintained by a specific division. Part of effectively acquiring data is finding these “silos” and integrating them into the broader data assets of the company.
- Prepare and Clean. Insight doesn’t just leap from raw numbers. Deriving value from data depends a great deal on the degree of preparation. How have you encoded your information, is the data structured in the most appropriate manner for processing by a machine learning system?
- Analyze. What stories do the data tell? Are there any patterns or conclusions that we can draw? Do we see any strong correlations between variables of interest and the outcome we are trying to measure? Can the data be applied (or generalized) to future information that has not yet been processed?
- Act. Once the data has been analyzed, does it tell us anything useful? Can we modify the process or take action on the intelligence it produced?
Once an insight or conclusion has been reached, though, does not mean that the process is at an end. Answers to some data questions invariably drive additional investigation and research. Do we have the most accurate model possible? Can we fine-tune parameters to give us better results? Can the model help to automate other processes?
While much of the attention is paid to steps three and four, it is steps one and two that consume somewhere between 85% to 95% of the time. Building robust systems to acquire and prepare data is extremely important, and will determine the success or failure of most projects.


Different Models, Different Purposes
So what computational tools enable us to analyze and gain insight from our data?
Broadly speaking, we use algorithms that implement statistical procedures including K-Nearest Neighbors, Naive Bayes, and artificial neural networks. Such approaches have been developed to help tease apart relationships in data and draw inferences. They have been around for decades (in some cases centuries), and have been used extensively in disciplines such as economics, physics, engineering, and statistics. So what makes the most recent wave of “Data Science” driven machine learning different?
While there are many potential answers to that question, one of the most important is perspective and procedure. Data Science actively encourages practitioners to shift between hypothesis-driven (deductive) and pattern-based/observational (inductive) reasoning. This is a major change from more traditional analytic approaches. Data Science approaches actively encourage an environment where models do not need to be entirely static and empirically based. Instead, they are constantly tested, updated, and improved until better models can be found and deployed.
More specifically, we leverage tools such as Python’s SciKit Learn or Apache Spark’s MLib. SKLearn (as SciKit Learn is sometimes called) and Spark are rigorous implementations of statistical algorithms that have been developed and validated by some of the best minds in mathematical computation. They are openly available without and do not require expensive licensing for their use. More importantly, though, when designing the interface (or the part that programmers and analysts interact with); the developers of these tools decided to make it easy to use them.
An easy to access interface means that software developers without a rigorous statistics background, analysts that are not programmers, and domain experts who are willing to get their feet wet can obtain and play with the software. The interface also encourages active experimentation. Instead of using deductive procedures to find an appropriate model, data scientists often trial many models in an approach sometimes called “try all the things.”

Deductive Reasoning
- Associated with “formal logic” and involves analysis from known premises toward a specific conclusion.
- Conclusions are part of a chain and are considered certain and inevitable.
- Used to create a hypothesis about behavior and construct formal tests between different classifications. Makes use of systems such as Student T-Testing, Chi-Square Testing, and Analysis of Variance (ANOVA).
Inductive Reasoning
- Draw uncertain inferences based on probabilistic reasoning.
- Conclusions are probable, reasonable, plausible, and believable.
- Draws upon exploratory data analysis to discover and refine hypotheses, which are then tested using deductive methods.
- Discover new relationships, insights, and analytic paths from data using techniques like K-Means clustering.

Machine Learning Fundamental Concepts
Ideas and background needed to navigate the machine learning landscape.
Types of Machine Learning
Algorithms make up the core of machine learning programs. When implemented in code as a set of rules to calculate, they let us solve data problems as a set of inputs that map to a target. The input is our data, the output is the solution that most accurately uses the data to predict an outcome. There are two primary types of approaches in machine learning: supervised learning, and unsupervised learning.
- Supervised learning is the most common type of machine learning. It can be thought of as telling the computer what type of conclusions to draw from a set of data and building systems that reach those conclusions in the most efficient manner possible. Supervised learning is often described as “putting things in buckets.”
- Unsupervised learning is an approach where the computer attempts to find meaningful differences among observations of a set of data. It might be used to conclude which neighborhood restaurants are popular by observing foot traffic, tidiness, or even make assumptions of food quality; it can even group customers based on their purchasing behavior, and recommend products that similar customers have purchased in the past.
Put succinctly, in “supervised learning” we tell the computer what we think is important. In unsupervised learning, the computer tells us. In the remainder of this article, we will look at some of the most common machine learning algorithms, talk about how they work, and discuss the types of problems to which they are applied.
Terms and Definitions
Before doing so, however, let’s briefly introduce some of the terms used when discussion machine learning.
- Classification: assigning a discreet value/observation in a dataset to a specific category or class. (True, False, executive, not executive, 1, 0). Classification problems have a small, or a relatively small number of outcomes.
- Example: classifying executives into persons of interest or not
- Prediction/Regression: predicting a new continuous value/observation (home prices, stocks, the value of items). In comparison to classification, predictions from regressors are part of a large range.
- Example: predicting a sales forecast based on historical trends
- Labeled Data: Information put into the algorithm. Sometimes called training data because it is used to generate the model.
Supervised Learning
Supervised learning algorithms try to model the best relationships and dependencies between the input values and outcomes of interest (targets). All supervised learning algorithms require labeled input training data. From that data, the model will pick up patterns and will create a solution (model) that can be used on new information (testing data).
Supervised Learning Algorithms
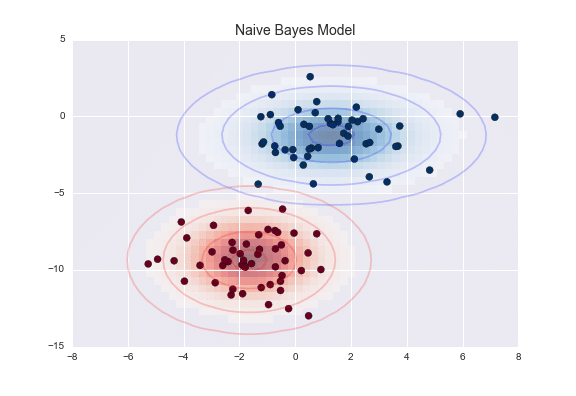
Naive Bayes is a classifier that utilizes probabilistic methods and the Bayes’ theorem. Naive Bayes categorizes data; it predicts classification probabilities for each set class and assigns data points to the highest probability class it fits in. Like a tag, it calculates a probability of a data point on how well it fits into each tag/class (Sport, Not Sport). Taking the highest match probability, that data point is set to that tag/class.
Advantages: fast, simple code, great use for natural language processing (NLP)
Examples: email spam detection, face recognition, image recognition, medical diagnosis, categorizing news.
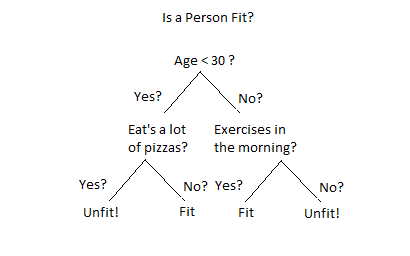
Decision Trees create a branching system that looks at variables of interest contribute to the outcome. It then ranks the variable’s contribution to the outcome and builds a set of “questions” that can help structure an assessment for new information. For example, if assessing whether a person is fit, the decision tree might break down variables such as age, whether or not they exercise, or they consume a large amount of pizza. Depending on how the answers to those questions break down, the decision tree is able to assign new data points to one of the outcomes of interest.
Advantages: fast, interpretable, handles missing data well
Examples: operations research/analysis, strategizing
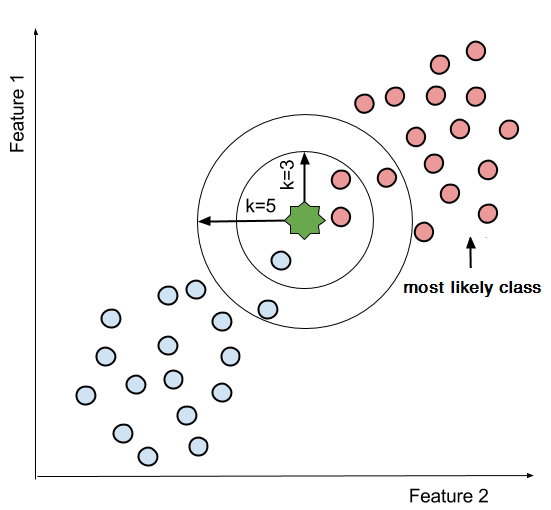
K-Nearest Neighbor uses a set of nearby points to predict outcome targets. This is done by accumulating the minimum distance from the neighboring data points and taking an average or consensus. This aggregation of close data-points determines the nearest neighbors. After processing all the nearest neighbors, the majority is select to be the prediction of the data points.
Advantages: simple, easy multi-class implementation, classification, and regression
Examples: concept searching, recommending systems, identification
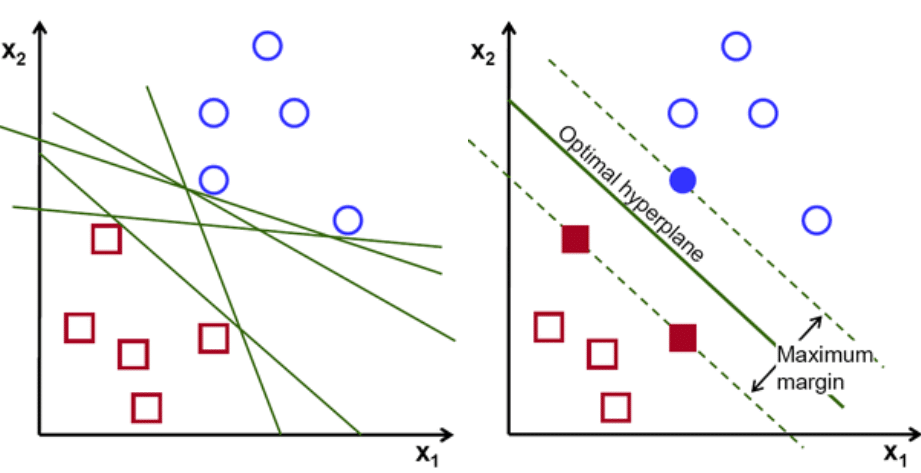
Support Vector Machines (SVM) algorithm produces a hyperplane that separates the data into classes. This algorithm works by transforming the data to a scatter-plot on a dimensional space that is defined by the number of features you have. These features have values that relate to the data points. Then classification is done by finding the divider (hyperplane) that differentiates the classes very well.
Advantages: working with unfamiliar data, low-risk of over-fitting, works well with unstructured data like text and images.
Examples: face detection, text categorization, image classification, bioinformatics.
Linear Regression is used to perform a regression task and finding a relationship with the data. If you’re familiar with Statistics, you’ll now that regression molds a prediction value based on independent variables. It’s best used to predict values within a continuous range (stocks, prices, profit) rather than using classification of categories (Sport, Not Sport)
Advantages: real-time predictions, continuous data forecasting
Examples: Forecasting values of stocks, sales, profits, house-value
Unsupervised Learning
Unsupervised learning is used to create clusters of data based on a set of input data.
While supervised learning requires heavy training input from humans on determining what is correct, unsupervised learning relies on no human intervention at all. All the input data has no corresponding output values, but rather the algorithm attempts to find rules, patterns, and summaries for groups of data points.
Unsupervised learning uses “Clustering algorithms” and “Association rule learning algorithms” .
- Clustering: A “cluster” is a group of closely related data points that are clustered by similar features and values
- Association: Used to discover rules and behavior that largely apply to the data, such as viewers that watch X, tend to watch Y as well.
Unsupervised Learning Algorithms
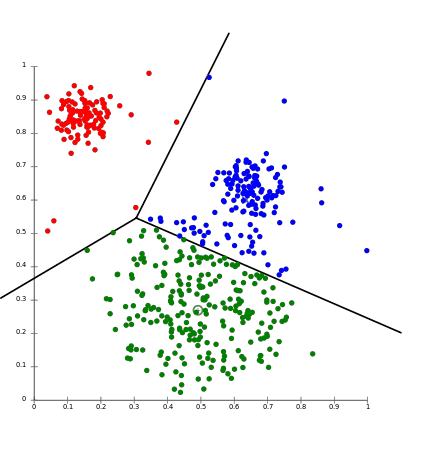
K-means clustering defines clusters as “centroids” (a point that centers a whole cluster). K-means works by assigning all data points to the nearest corresponding cluster. From each centroid, the mean of all the values of containing data is calculated to produce a value to hold as the new centroids
- Examples: spam filter, fake news identifier, classifying network traffic.
Anomaly detection is a type of algorithm searches for unusual patterns that are misaligned with the expected behavior of the dataset. These ‘anomalies’ are also known as outliers.
- Examples: analyze traffic patterns for unusual network activity that may attempt to hack systems, identifying bank fraudulent behavior, system health monitoring.

Neural Networks
The supervised and unsupervised techniques that we’ve looked at to this point are often called “classical” machine learning. In recent years, another form of machine learning called “Deep Learning”, which leverages neural nets, has emerged enabling more sophisticated applications than ever before.
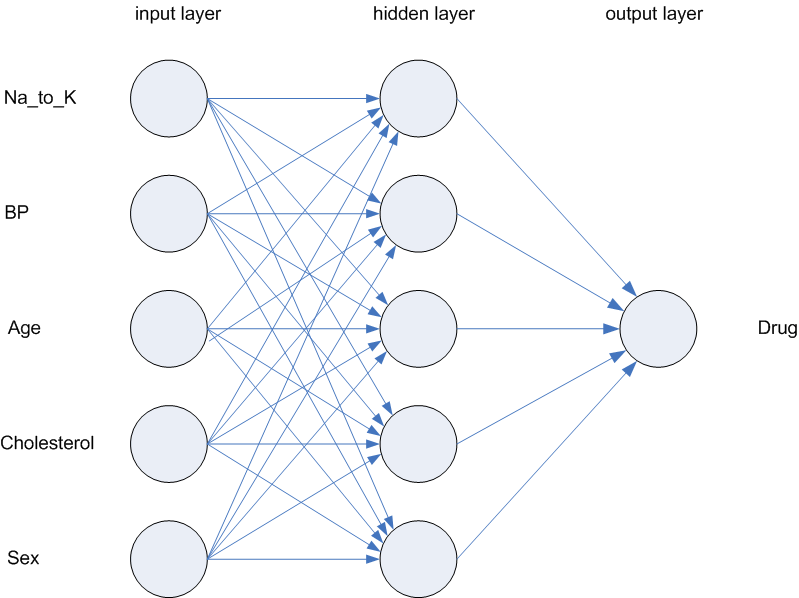
Artificial neural networks, which are computer simulations patterned after the human brain, consist of thousands or even millions of nodes that communicate and interact with one another. These nodes are organized through layers of one-way channels that allow for the simulation to interpret the data moving through the network. Nodes in each layer are connected to nodes in other layers through association. These associations are called weights and partially control the association that the network will make about the data.
The networks created from these pieces are where AI comes closest to modeling the human mind. Deep learning has been used to rival human beings in games of strategy like Chess and Go, diagnose eye diseases with the same accuracy as trained physicians, and enable the advanced logic required for self-driving cars.
For more information about neural networks and deep learning, check out these videos:
- But what is a Neural Network?
- Gradient descent, how neural networks learn
- What is backpropagation really doing?
Semi-supervised Learning
So what about problems that require components of supervised and unsupervised learning techniques?
Not every data source has enough labeled data to train a model. As an example, consider the problem of distracted drivers. One in five car accidents is caused by people who drive while texting, browse social media on the road, or engage in hand-held conversations when they should be paying attention to traffic signals. Through the use of traffic cameras, large numbers of images which show drivers in traffic have been published. However, labeled images that clearly indicate drivers using cell phones or otherwise driving while distracted, are far less common. In such a set published by State Farm, there are 80,000 overall images but only 20,000 are labeled. To accurately train a model, we need a way to augment the labeled data.
In semi-supervised data, you use a combination of supervised and semi-supervised techniques to bootstrap a classification model. One approach, called pseudo labeling, works in the following way:
- Train a model from labeled data.
- Use that model to predict the target of interest for output data (these are the pseudo labels). At this point, it is unknown if the predictions are accurate.
- Join the features of the training set with the pseudo labels and use an unsupervised technique to find discrete clusters on the entire set of data. Use the clusters to help refine the predictions for the pseudo-labels and apply the technique a second time.

Machine Learning Parts and Pieces
Libraries, tools, and techniques needed to take the first steps with machine learning.
Machine Learning in Python
So what does this look like in practice? How might you go about building a simple model?
The code listing shows an example of building a classifier in Python (using SciKit Learn). Libraries like SciKit learn, make it easy to start experimenting with data and machine learning systems. All of the models in SciKit learn implement the same interface, which means that it’s straightforward to try different algorithms and assess which models best fit the data.
While data science is a complex and difficult field, the programming required is only a small piece. Building and assessing models are often only three or four lines of code. Decisions made in collecting and preparing data, assessing the model for how well it fits, testing the model for how it handles new data and many other considerations are also very important.
# Import SciKit Learn: Library Used to Train/Assess Models
from sklearn import datasets

# Import a Learning Library (Naive Bayes)
from sklearn.naive_bayes import GaussianNB

# Import a Sample Dataset: The Iris Dataset includes information
# about different types of Iris Flowers. It is commonly used when
# testing unsupervised clustering algorithms
iris = datasets.load_iris()

# Create a machine learning model instance and train the model
gnb = GaussianNB()
gnb.fit(iris.data, iris.target)

# Create a prediction using the model instance. This example uses the
# input (training) data as a way of testing the resulting model.
# A more robust way of testing would be to train with one part of the
# dataset and test with a second.
y_pred = gnb.predict(iris.data)

# How did the model do?
print('Mislabeled data points: %s'
    % (iris.data.shape[0], (iris.target != y_pred).sum()))
Tooling & Libraries
Python has become the dominant platform for machine learning (and data science in general). The links below point to tools, runtimes, and libraries that can be used to get up and running with machine learning.
Software
- Jupyter-Notebook – simple and powerful tool for computing data analysis problems. The majority of data scientists use Jupyter-Notebook
- Anaconda – powerful all-in-one data science package that includes: Python / R distribution, Jupyter-Notebook, package manager, environment manager. For more information, read our article about the Anaconda Python Distribution.
Programming Languages
- Python – simple high-level general purpose programming language.
- R – a programming language used for statistical programming, data analysis, and machine learning
Libraries
- Scikit-learn – most popular machine learning library for deploy supervised and unsupervised machine learning models.
- Tensorflow – machine learning and deep learning library that is more heavyweight than scikit-learn, best for deploying neural networks.
- Pytorch – deep learning library that supports GPU-accelerated computations.
- Pandas – most popular data extraction and preparation tool for organizing your datasets.
- NumPy – a core component of scikit-learn and pandas, best for creating multi-dimensional arrays.
- SciPy – library used to compute scientific calculations, a core component for scikit-learn.
- Matplotlib – powerful graphing library to visualize data, very useful for monitoring a model and its datasets.